
In this tutorial, we will walk step by step through building a simple custom report in Oracle BI Publisher. For more on how the tables fit together in Oracle Fusion, see our companion tutorial on BI Publisher table structures.
Every BI Publisher report is linked to a data model, which holds all the data the report uses. So before we build the report, we will create a data model and pull the data from the Fusion tables with SQL.
Creating the Data Model
Step 1: From the New dropdown, select Data Model.
Step 2: A list of properties appears on the left that you can customize for the data model. The Parameters property, for example, lets you add parameter selections to the report. For this example, we will only use the Data Set property.
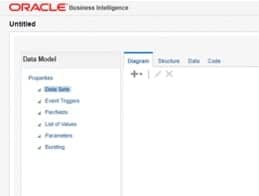
Step 3: Under the Diagram tab, click the plus sign and choose SQL Query. A window opens for the data set. I named mine "Invoice" and selected FSCM as the data source.
Step 4: Enter a simple query that pulls all the data in the AP invoices table (shown in the text area below), then click OK.
Step 5: BI Publisher generates a list of the columns stored in the Invoice table. Now suppose you need a report that shows only the unpaid invoices, meaning a value of "N" in the Payment_Status_Flag column. How would you get that?
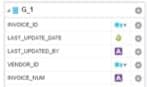
Step 6: Click the gear icon at the top right of the data set and choose Edit Data Set. That takes you back to where you entered the SQL. This time, modify it to pull only the columns you need and filter for unpaid invoices:
SELECT INVOICE_NUM, INVOICE_DATE, INVOICE_AMOUNT, PAYMENT_STATUS_FLAG
FROM AP_INVOICES_ALL
WHERE PAYMENT_STATUS_FLAG = 'N'
Step 7: Click OK. You will notice this trims the data set down to only the fields you specified.
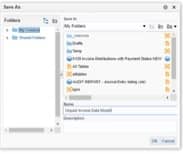
Step 8: Click the save icon in the top right corner of the work area. Give it a name you will remember, then click OK. In my example, I saved it to My Folder.
Creating the Report Layout
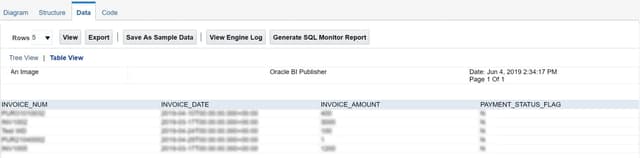
Step 9: Before building the layout, generate some sample data to work with in the report editor. Click the Data tab and choose how many rows to display. Five is usually enough, unless you are validating data.
Step 10: Click View, then Table View, to generate the top five rows currently in the data model. If you are happy with the results, click Save As Sample Data. The report editor will then use these five rows to display the template layout.
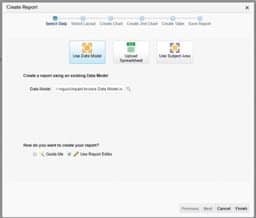
Step 11: With your sample data saved, start a new report from your data model.
Step 12: You will be prompted to save the report. In my example, I named it "Unpaid Invoice Report" and saved it in the same folder as the data model.
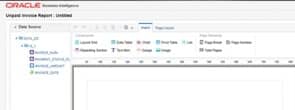
Step 13: For the layout, I am choosing Blank Portrait, but don't worry, you can change the orientation later or pick your own.
Step 14: In the report editor, open the Insert tab and drag a Data Table onto the sheet. This creates a table area where you can place the columns.
Step 15: Under the Data Source tab on the left, you will see all the columns from the data model. Drag the ones you want into the table area, and resize them by dragging their edges.
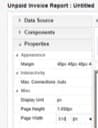
Step 16: You can rename column headers by double clicking a field. Page width lives under the Properties tab, and conditional formatting is available under Highlight once you select the column you want to format.
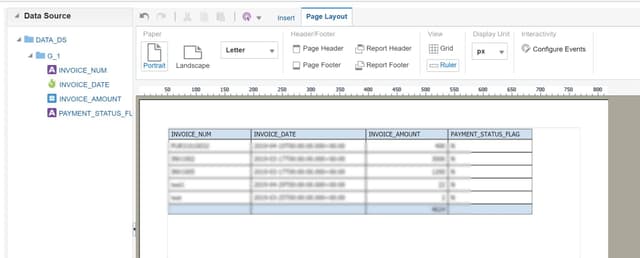
Step 17: Once you are happy with the layout and its styling, save it.
Step 18: Since one report can hold several layouts, give each layout a clear name to avoid confusion. To export the report, click the gear icon at the top right.
Oracle Fusion Support
Need help implementing or maintaining Oracle Fusion or BI Publisher? Our consultants at CloudADDIE know EPM software well and can help your company implement, troubleshoot, and maintain your Oracle Cloud Services. We also offer training.