
Every reporting question a finance team asks has the same shape: some number, sliced by some context. Revenue by product. Headcount by department by month. Expenses by cost center against budget. Dimensional modeling is the design discipline built around that observation, and it was formalized by Ralph Kimball, whose data warehouse methodology remains the standard reference for this style of design. This post explains its two building blocks, fact tables and dimension tables, in plain terms, and why the distinction matters to anyone building or buying an analytics platform.
Numbers and the context around them
Start with what a business actually measures. A posted journal line, a sale, an hour of labor: each event produces one or more numbers, and each number is meaningless without context. The amount 41,250 tells you nothing until you know it was salary expense, for the Houston office, in cost center 4400, for March.
Dimensional modeling splits those two ingredients apart:
- Facts are the measurements: amounts, quantities, balances, counts. They are numeric, they arrive constantly, and they pile up into millions or billions of rows.
- Dimensions are the context: account, entity, department, period, product, customer, employee. They are mostly text, they change slowly, and they are what people filter and group by.
A fact table stores the measurements. A dimension table stores one category of context, one row per member, with all the descriptive attributes a report might want: an account's name, its type, its rollup; a department's manager, region, and company code.
How the star schema ties them together

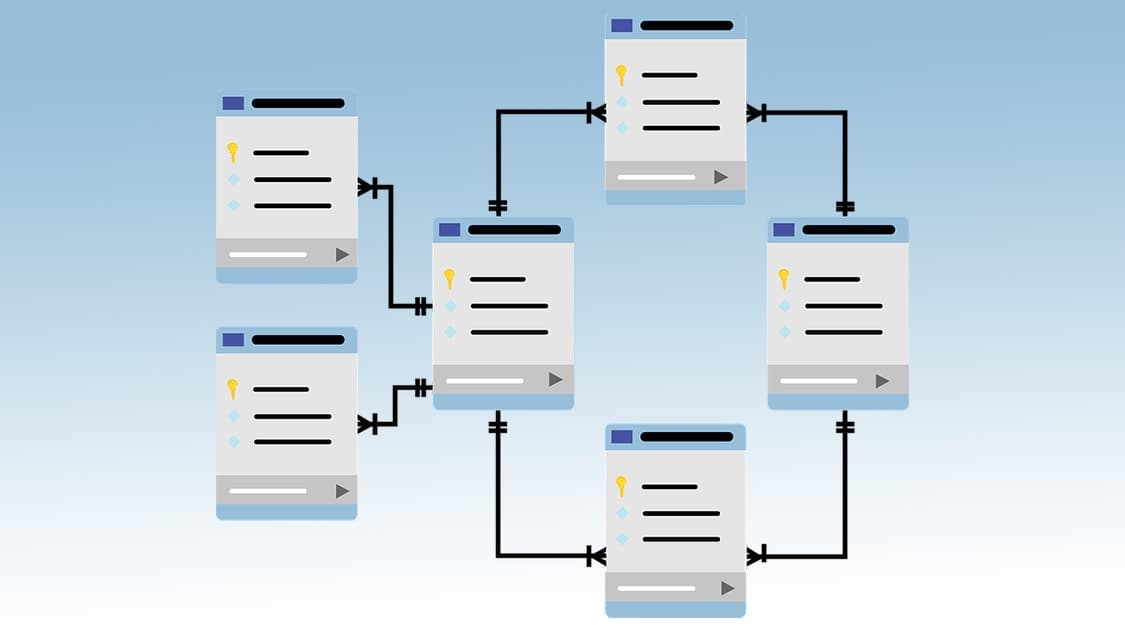
The classic arrangement is the star schema: one fact table in the middle, dimension tables around it. Each row in the fact table carries one foreign key per dimension, and each of those keys points at exactly one row in its dimension table. A row in a GL fact table might read: account key 118, entity key 42, department key 7, period key 202603, amount 41,250. Join outward to the dimension tables and the codes become names, hierarchies, and attributes a report can display.
Two design habits keep this structure healthy in practice:
Use surrogate keys. The keys that link facts to dimensions should be meaningless integers generated by the warehouse, not the natural codes from the source system. Source codes get reused, recycled, and restructured; ERP migrations renumber everything. A warehouse keyed on surrogate integers absorbs those changes. One keyed on source codes inherits every one of them.
Never leave a foreign key empty. Real data is messy, and some transactions will arrive without a department or a customer. Rather than storing a null key, dimensional designers add an explicit member to the dimension itself, a row for "Unassigned," and point the fact row at it. Every fact row then joins cleanly to every dimension, and the unassigned bucket is visible in reports instead of silently dropped by a failed join.
Dimension tables are deliberately kept flat and denormalized: all of a product's attributes in one wide row, even if brand and category repeat across thousands of products. Normalizing those repeats into their own little tables (a design called snowflaking) looks tidier on paper but makes queries slower and the model harder for users to navigate. The repetition is the point; storage is cheap and query simplicity is not.
Grain: the one decision that makes or breaks a fact table
Before a single column is designed, a fact table needs a declared grain: a precise statement of what one row represents. One row per journal line. One row per invoice line per day. One row per employee per month. Everything else follows from that sentence, because the grain determines which dimensions apply and which facts are legal to store.
Mixing grains in one table is the classic modeling mistake. Daily transaction amounts and monthly summary balances do not belong together, because any query that sums across them quietly double counts. When measurements exist at two different grains, they get two different fact tables, full stop.
Not all facts add up the same way
The whole reason fact tables work at scale is aggregation: nobody reads a billion rows, they sum them. That works best when facts are stored in an additive form, which is why a well-designed sales fact table stores extended amount and quantity rather than unit price. Price does not add across rows; amounts do, and price can always be derived from them.
Some measurements resist addition. Balances and inventory levels are snapshots: adding January's cash balance to February's produces nonsense, though averaging across months or taking the latest value is fine. These are semi-additive facts, and they need aggregation rules chosen deliberately. And some fact tables legitimately contain no numeric facts at all. A row recording that an employee attended a training session on a given day has dimensions (employee, course, date) and nothing to sum; counting the rows is the measurement. These factless fact tables are common in workforce and compliance reporting.
Why this matters to EPM teams

If this structure feels familiar to anyone who has administered an Oracle EPM application, it should. An Essbase or Planning cube is dimensional modeling by another name: the data values are facts, and Account, Entity, Period, Scenario, and the rest are dimensions with members and hierarchies. The design questions are the same too. Deciding a cube's dimensionality is declaring grain. Loading data to an "Unassigned" member instead of failing the load is the same null-handling discipline. And the reason EPM applications feel natural to finance users is exactly the reason Kimball's approach won in the warehouse world: it mirrors how business people already think about their numbers.
The practical payoff of getting fact and dimension design right is a warehouse that answers questions quickly, survives source system changes, and stays understandable as it grows. Getting it wrong produces the opposite: slow queries, double counts, and models only their original designer can navigate. If your organization is somewhere between those two outcomes, whether in a data warehouse, an EPM platform, or the pipeline connecting them, that is precisely the kind of engagement CloudADDIE takes on.