


ARCS extract in OTBI

By: Sunil Keezhangattu - Sr. Principal Consultant
Published:
October 22, 2020
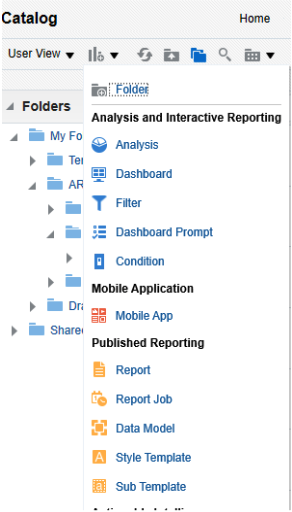
1. Select “Data model” from the ‘New’ drop-down menu
2. The properties of the data model will be shown on the left-hand side of the window, we can customize the data model for instance adding parameter selections.
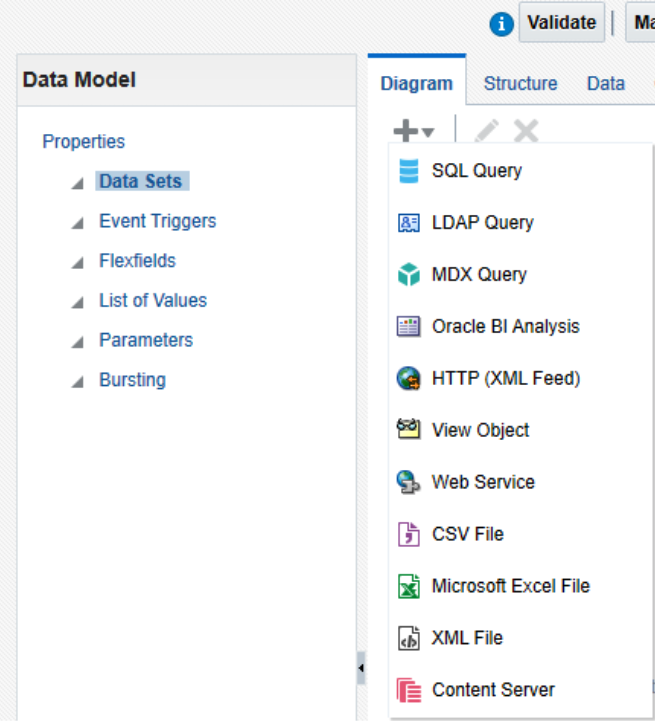
3. Click on the “+” sign on the top-left corner in the ‘Diagram’ tab to create the new data set. Then select “SQL query”. A window will pop-up to create the script.
4. For the data source, select “ApplicationDB_FSCM” and “Standard SQL” for Type of SQL selection. Name the data model the way you want.
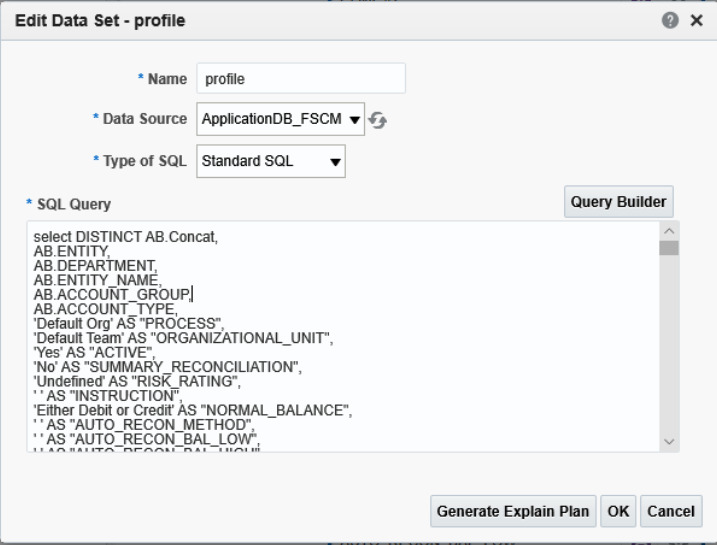
5. Input the query to retrieve all the data from multiple tables in which it contains. Select only the columns we need to show in the report. Then, link all the columns from multiple tables by common keys.
There are some main tables used to retrieve data for ARCS extract:
- GL_CODE_COMBINATIONS
- GL_BALANCES
- FND_FLEX_VALUES
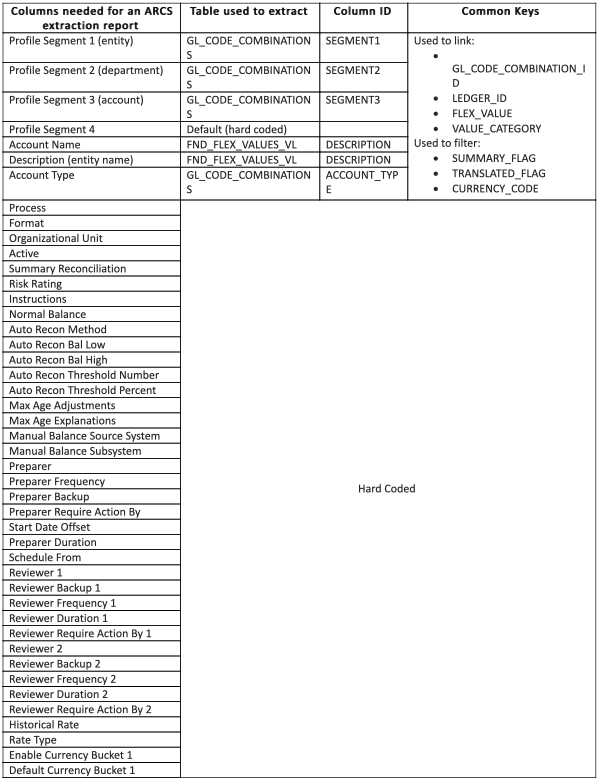
6. For the ARCS profile extract, there are a lot of columns we need in order* to build successfully successful* profiles in ARCS. But the most important columns that need to be focused are Profile Segment 1, Profile Segment 2, Profile Segment 3, Profile Segment 4, Account Name and Description. The other columns can set as default.
Apply all the filters to take away the unwanted intersections to avoid them from showing up in the report. This step can be based on the mapping in Data Management. After that, click ‘OK’.
Below are the tables showing all the columns needed for an ARCS extraction report, also the tables which contain the value and the key IDs used to extract data.
7. After completing the script, click on the save icon in the top-right corner, input the name, and select the folder you want to save it into.
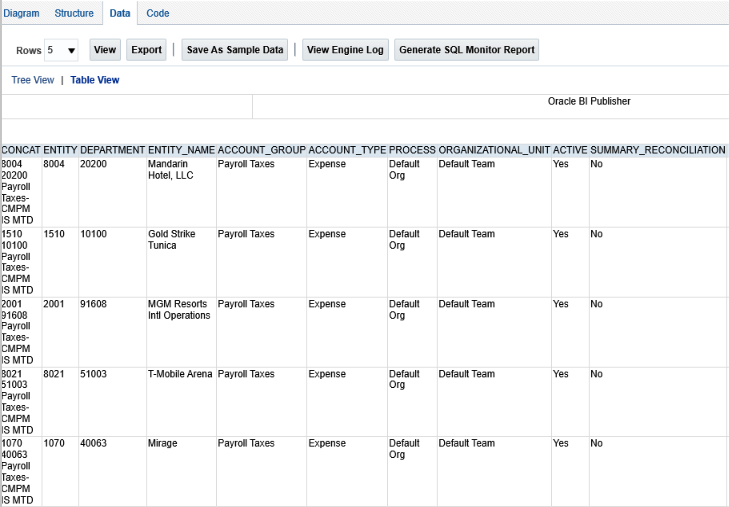
Before we can start creating the report layout, we need to generate a set of sample data so that it can be used while building the report layout. Click on “Data” tab and select how many numbers of rows to display (there are options to show from 5 up to 200 rows). The purpose of this step is usually to validate the data. Click “View” to proceed and select the “Table View”. Then click “Save As Sample Data” if this data set is okay and ready to build the report layout.
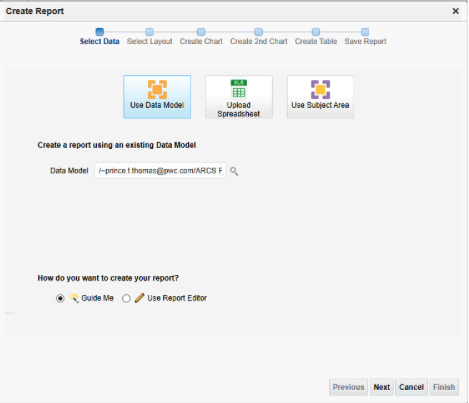
8. Click on “Create Report” then a window will pop-up. Select “Use Data Model” and “Use Report Editor” and click “Finish”.
I will select the Blank (Landscape) for this report since there are a lot of columns needed to show.
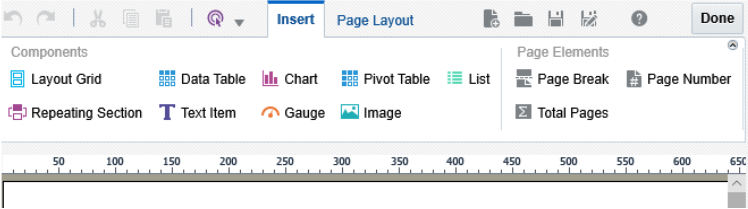
9. In the report editor, click on the “insert” tab, then drag and drop “Data Table” to the sheet. This will create a table area where you can place the columns.
10. Under the “Data Source” on the left-hand side, all columns built in the data model will show up. Drag and drop the columns to the table area and adjust the width to fit the page and content.
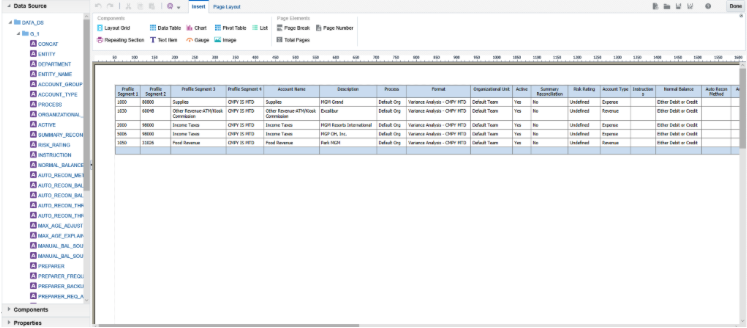
There are options to change the headers just by double clicking on the field or changing the formatting is under the “Properties” tab. Save it once finish you’re finished by clicking “Done”.
11. Click “View Report” to preview your completed report and export it by selecting “Export” in “Action” menu.
FREE CONSULTATION
Schedule your Free Consultation, to see it in action!
Contact Us!
We offer Autonomous Systems for EPM Cloud Applications such as Oracle Planning & Budgeting Cloud Service (PBCS/EPBCS), Financial Close & Consolidations Cloud Service (FCCS), Enterprise Data Management Cloud Services (EDMCS), Account Reconciliation Cloud Service (ARCS), Profitability & Cost Management (PCM) and more.